Campaign Intelligence
What should the next run change?
Follow the response past the first interaction: clicks, video plays, conversions, page flow, and drop-off, traced back to the assets, locations, teams, and partners behind it.
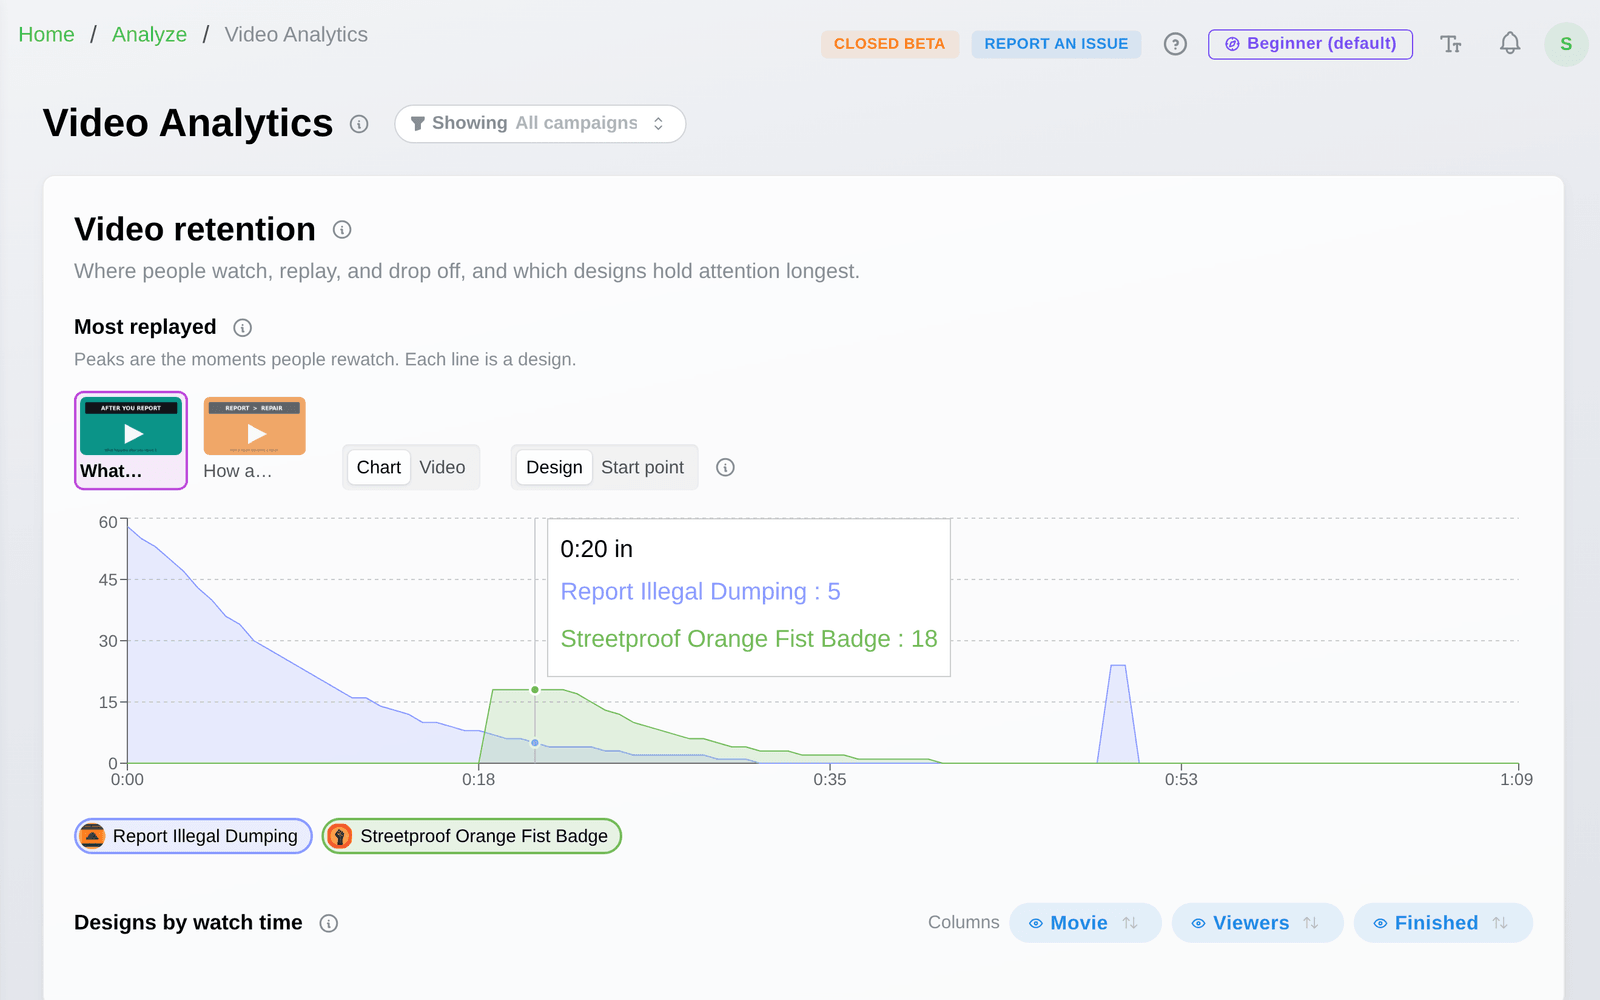
“They scanned and played the video. How far did they get?”
See the moment people replay
When your landing page carries a video, the replay curve runs its full length. Tall spots are the moments people rewind. A dip is where they stop watching.
- Which moment people replay
- Where viewers drop off
- Which asset holds attention longest
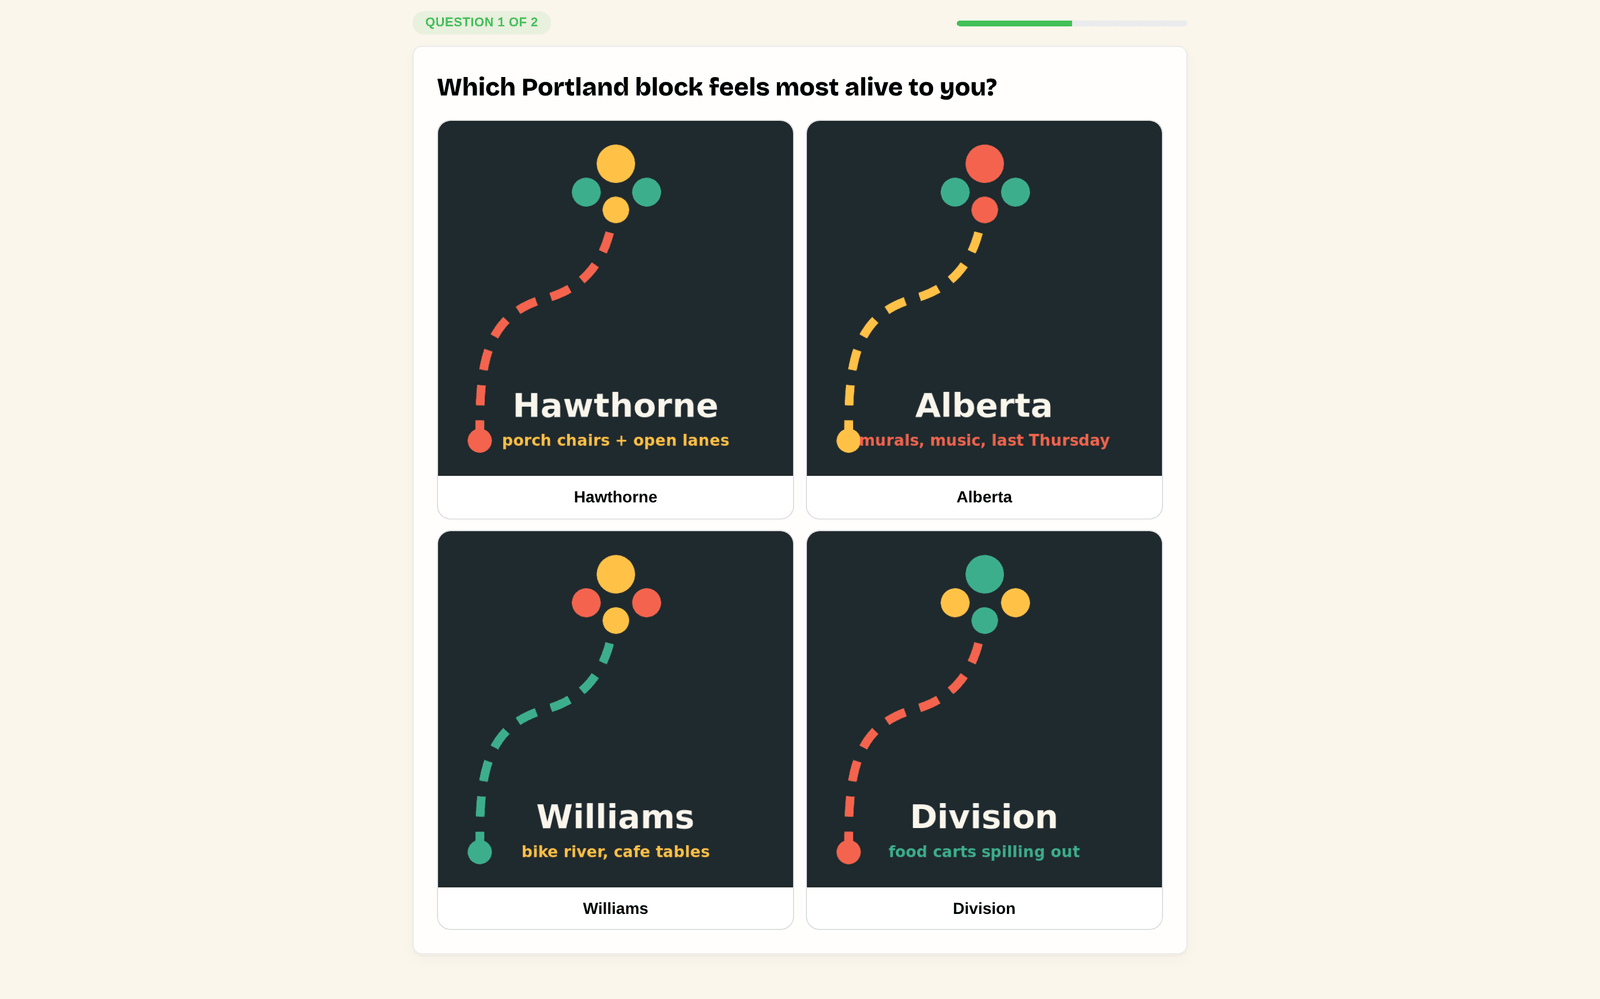
“What does the design make people think?”
Ask your audience right on the landing page
Drop a question onto the landing page people reach from a scan or short link. They tap an answer, the bar fills, and you read how the crowd is leaning. Each response ties back to the asset and spot that sent them there.
- Image-tile or text questions, your wording
- Live results as answers come in
- See how each asset and location answers differently
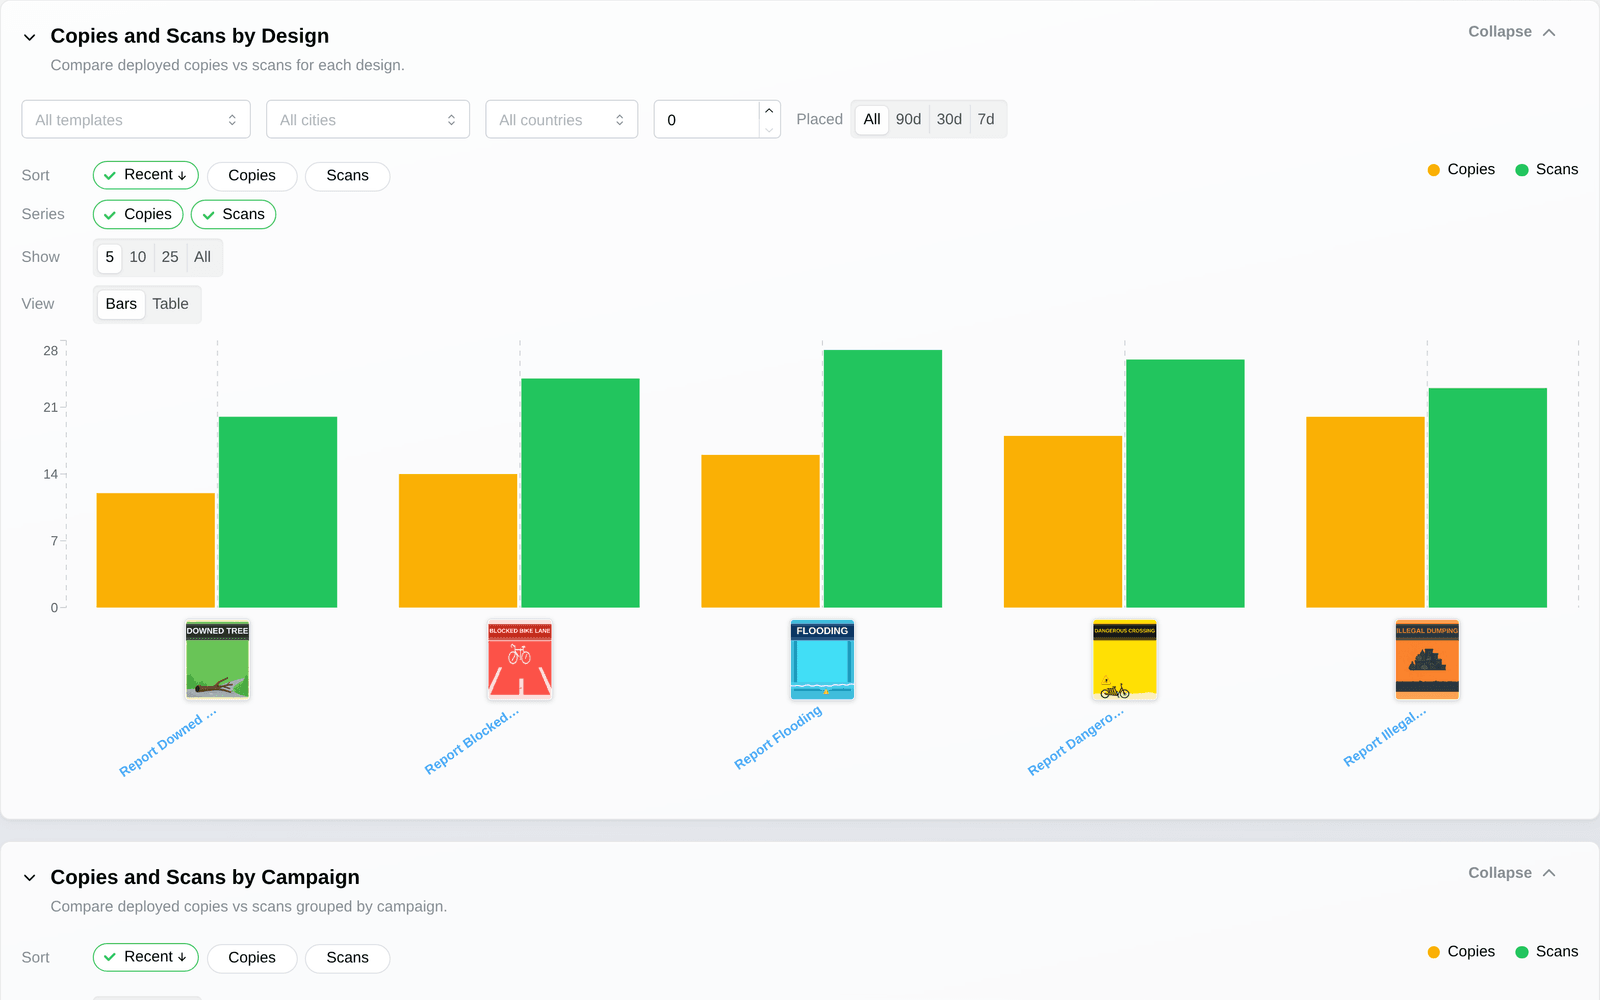
“Which assets, teams, and location types are getting results?”
Put the numbers side by side
Build a dashboard, set alerts, and share it with whoever needs the numbers.
- Which location types draw the most response
- Which assets hold up across sites
- Which ones go quiet
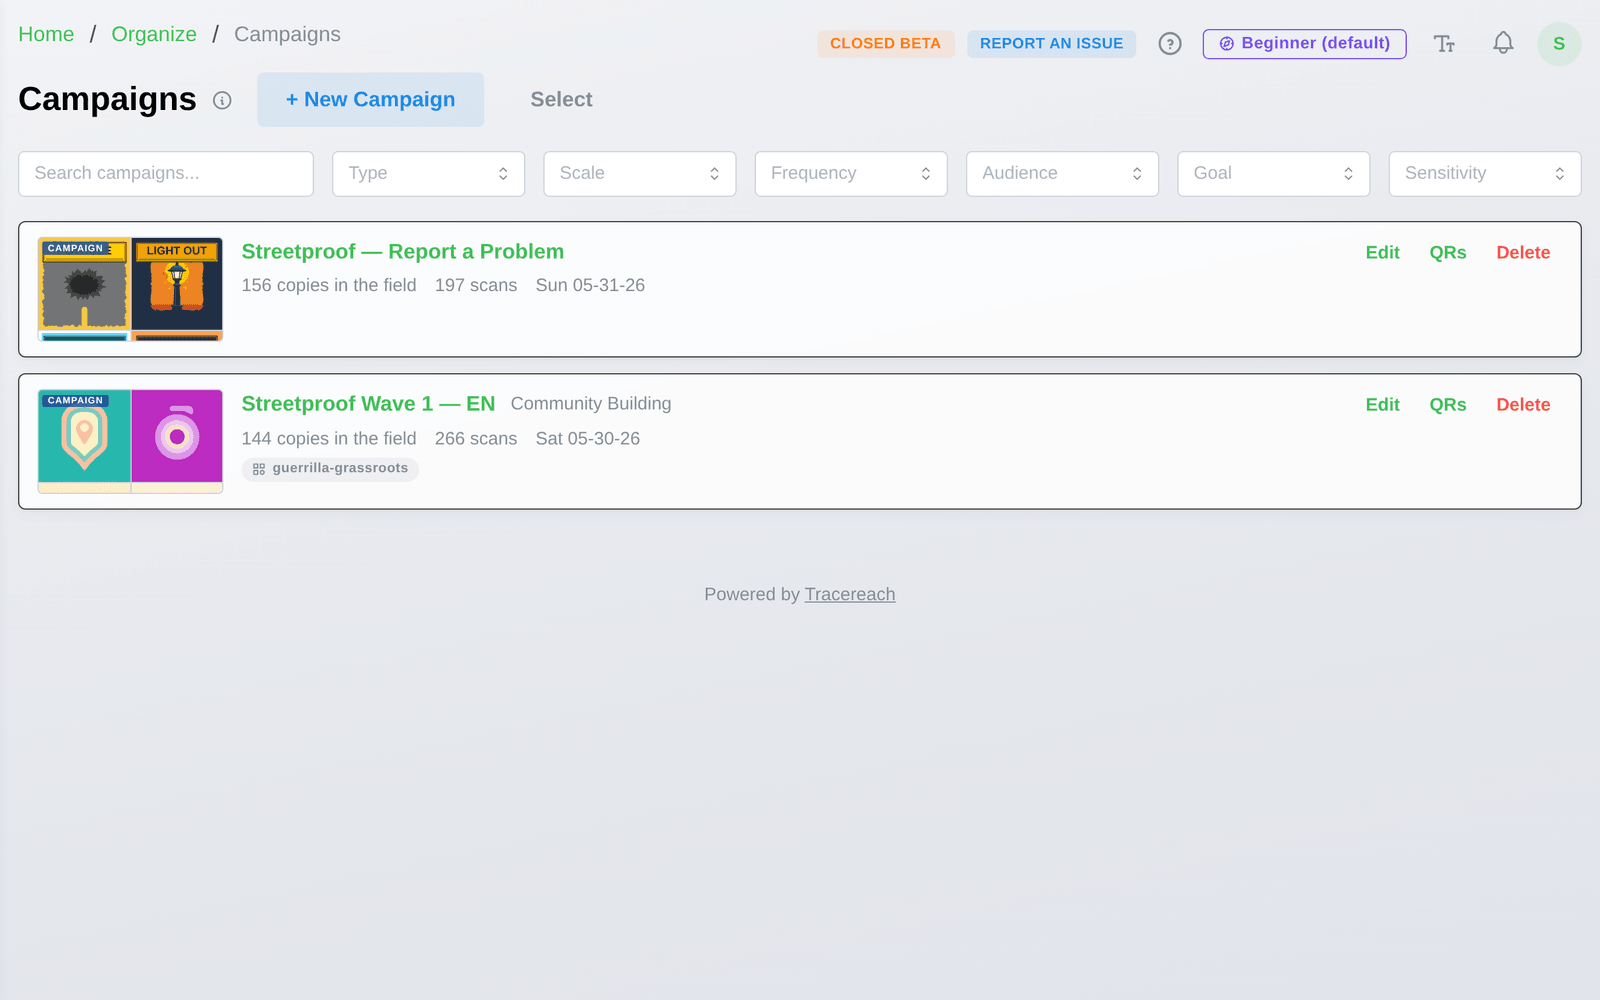
“Running multiple campaigns at once?”
Compare across campaigns and location types
Build the query, share the dashboard. Filter by:
- Campaign
- Location category
- Time period
- Asset template
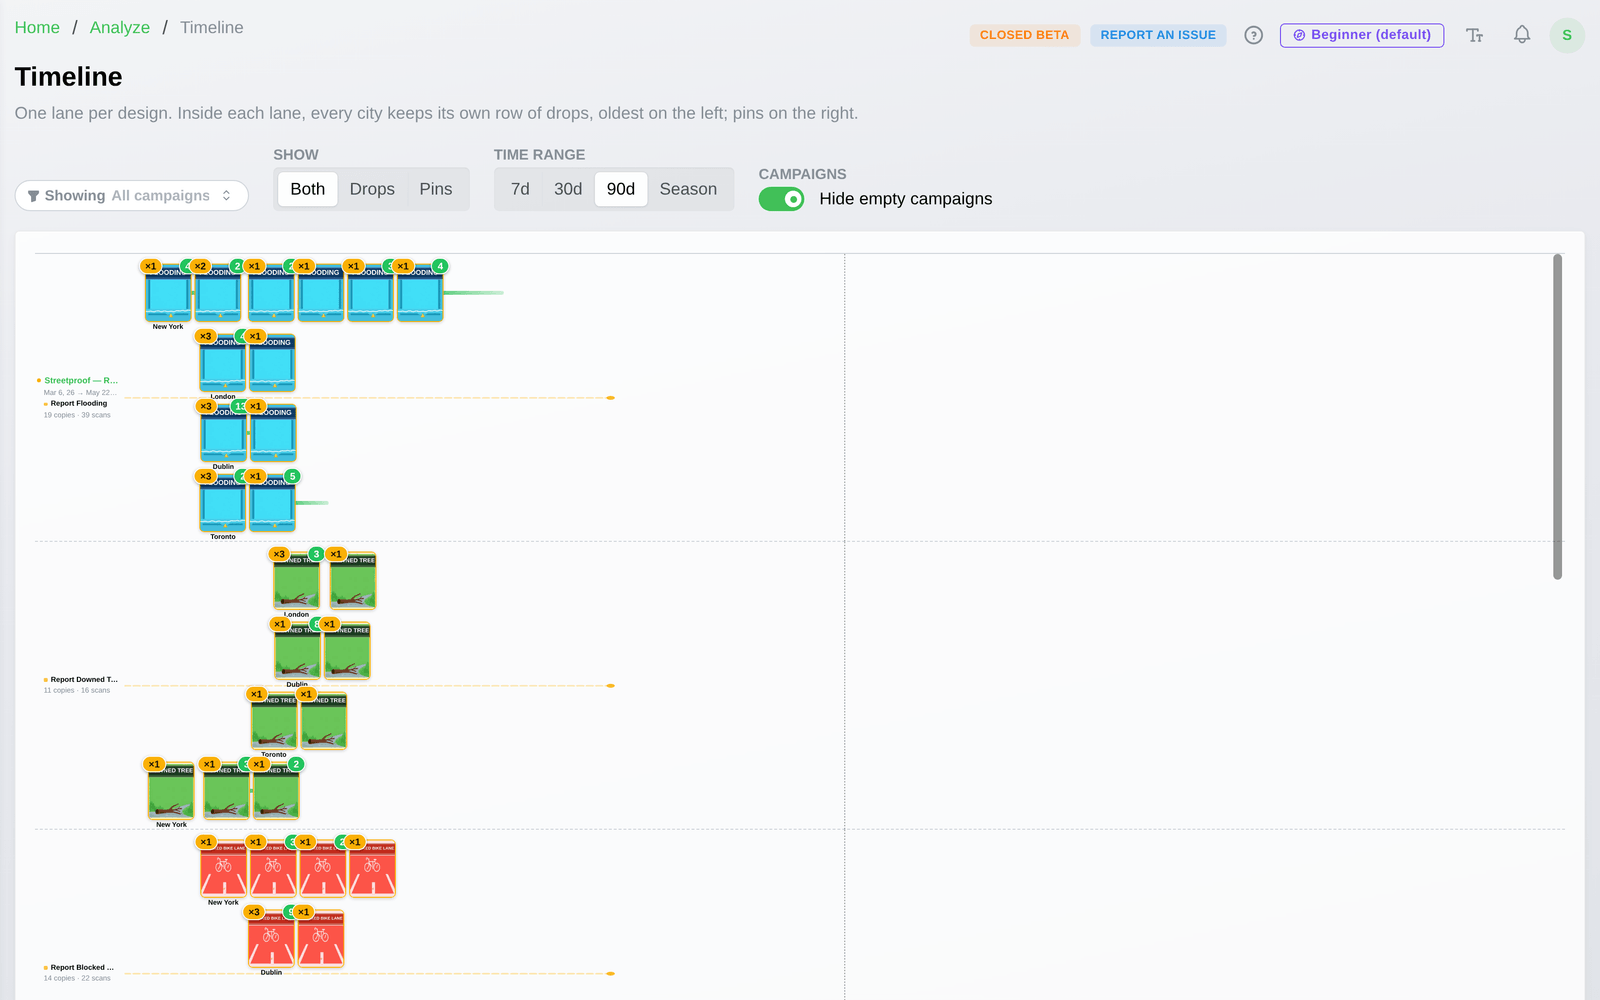
“When did each campaign go up?”
See your drop cadence over time
One lane per design, with a row for each city. Drops land by date, oldest on the left; the pins still waiting sit on the right.
- Spot bursts and quiet stretches at a glance
- See which pins are oldest and still due
- Scope to 7, 30, 90 days or the full season
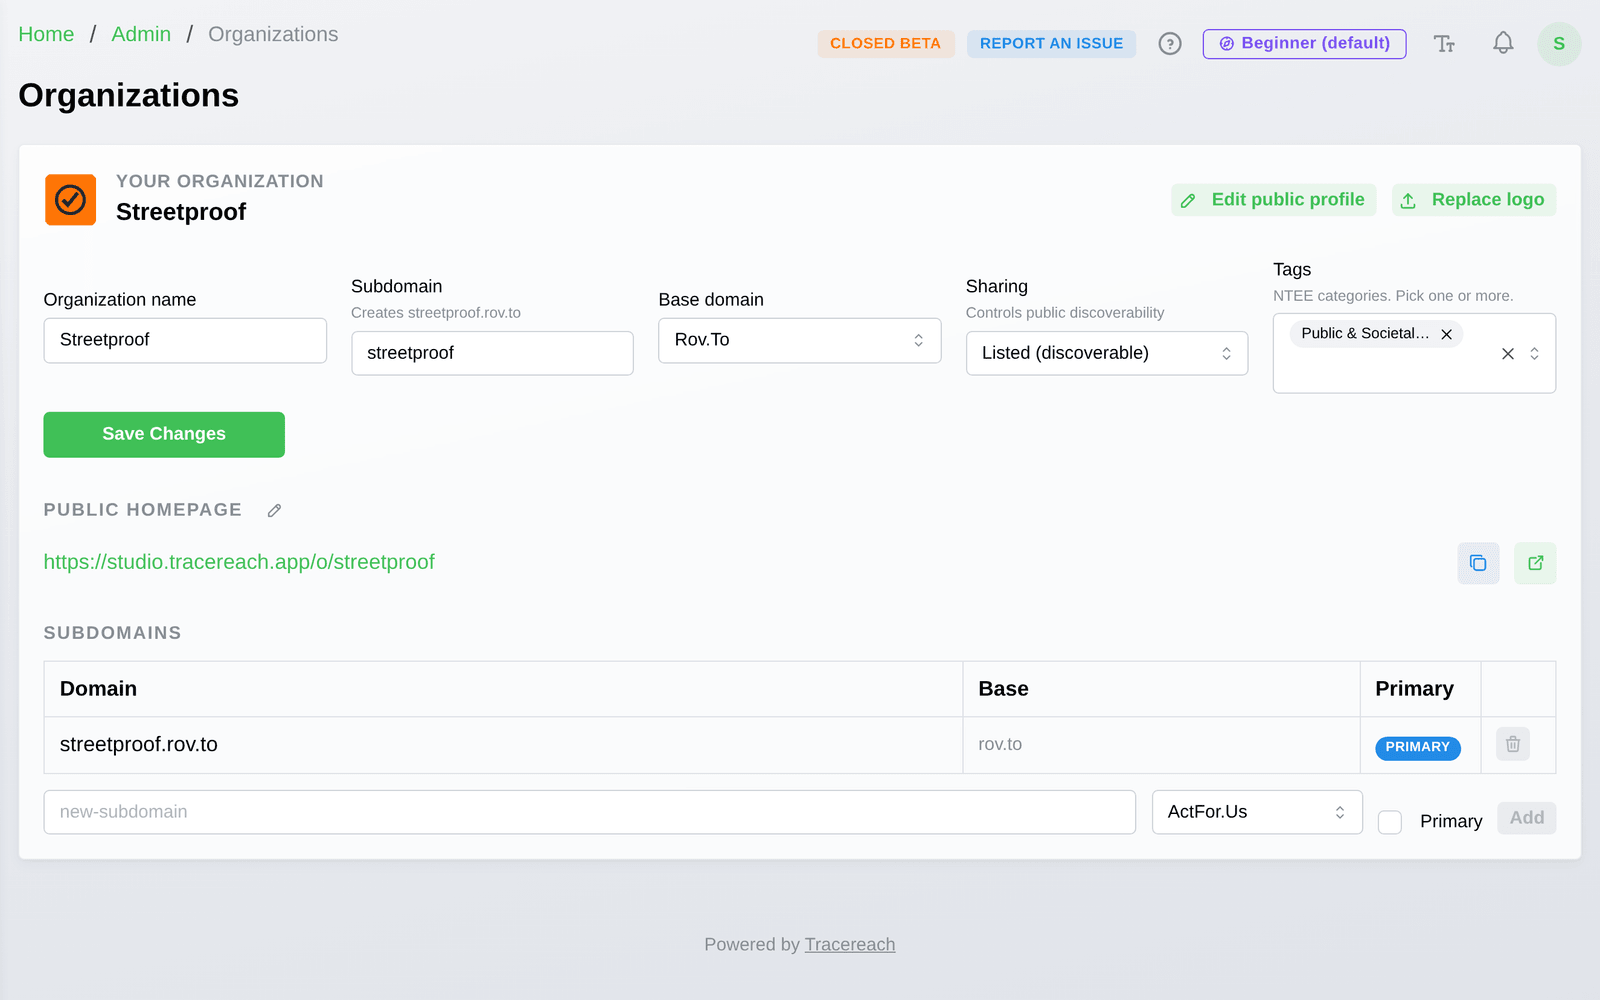
“Sharing data across partner orgs”
Collaborate across organizations
Partners see what they need. Works for one team or twenty.
- Share campaigns across orgs
- Share templates and analytics
- Role-based access per org
TraceReach is operated by TraceReach LLC.
Start with one full campaign loop.
Plan locations, assign teams, verify the work in the field, and compare the response the campaign got.