Analyze Engagement
Which locations, assets, teams, and partners got the response?
Compare the response during and after the run: hot spots, cold spots, landing-page behavior, video analytics, and campaign performance tied back to the operating record.
“Where is engagement concentrating?”
Watch hot spots and cold spots emerge
A heat overlay shows engagement where it happens. Red blooms mark the locations drawing attention, green fades to the quiet ones, and each field record keeps its proof and attribution behind it. Zoom in to pull nearby Drops apart and see which exact spot is carrying the response.
Preview TraceReach Studio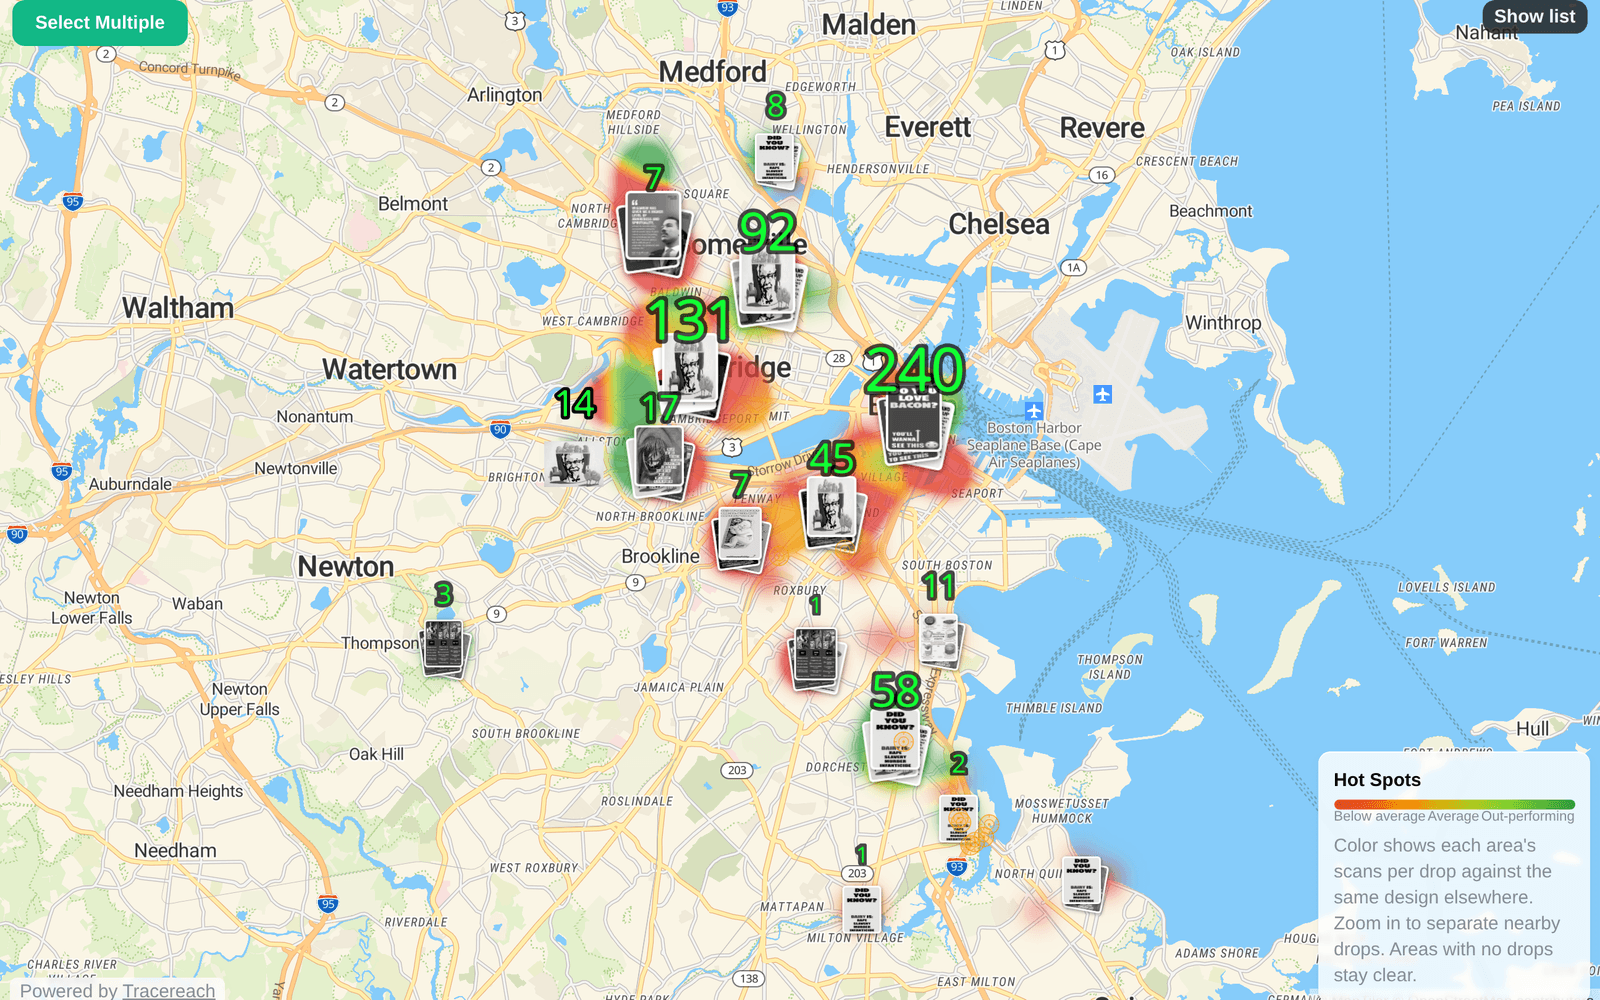
“A location that was active just went cold”
Know when to investigate
When scan volume drops at a site, check it. The material may be gone, damaged, or covered, or the foot traffic may have shifted. You find out from the data, not from a phone call.
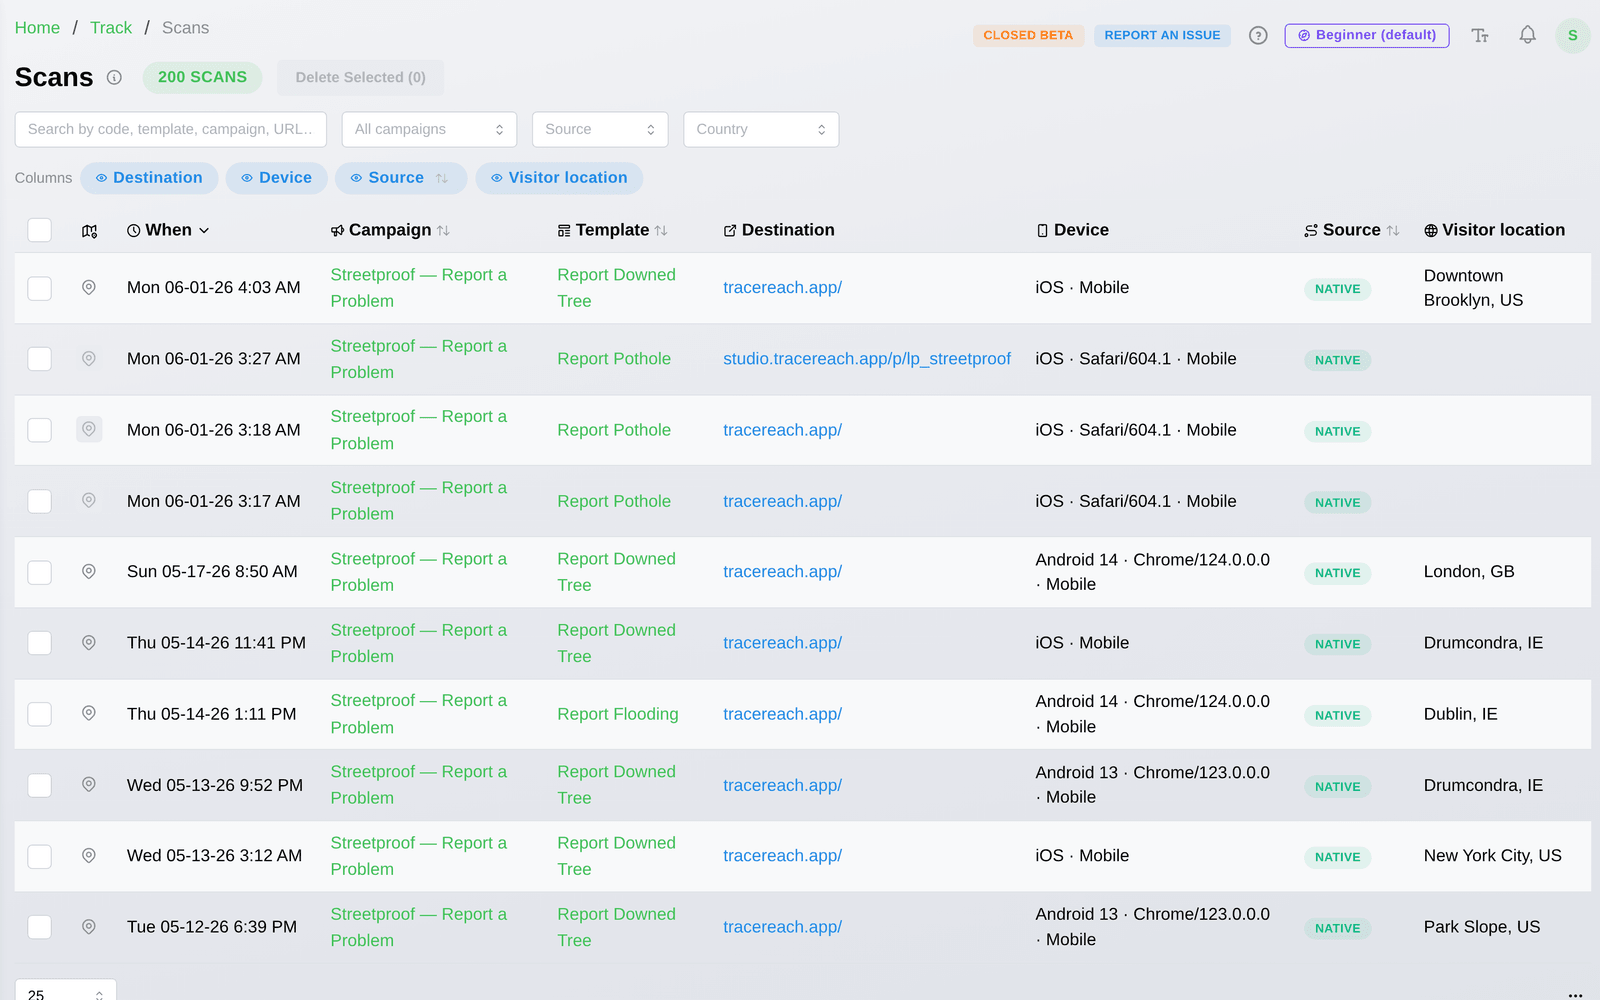
“What kind of place is driving engagement?”
Coffee shops, transit stops, campus quads
Locations carry category data: what's nearby, the kind of foot traffic that walks past. See whether transit hubs outdraw retail corridors, or that campus locations peak on weekday mornings. The pattern is there to weigh when you plan the next assignment.
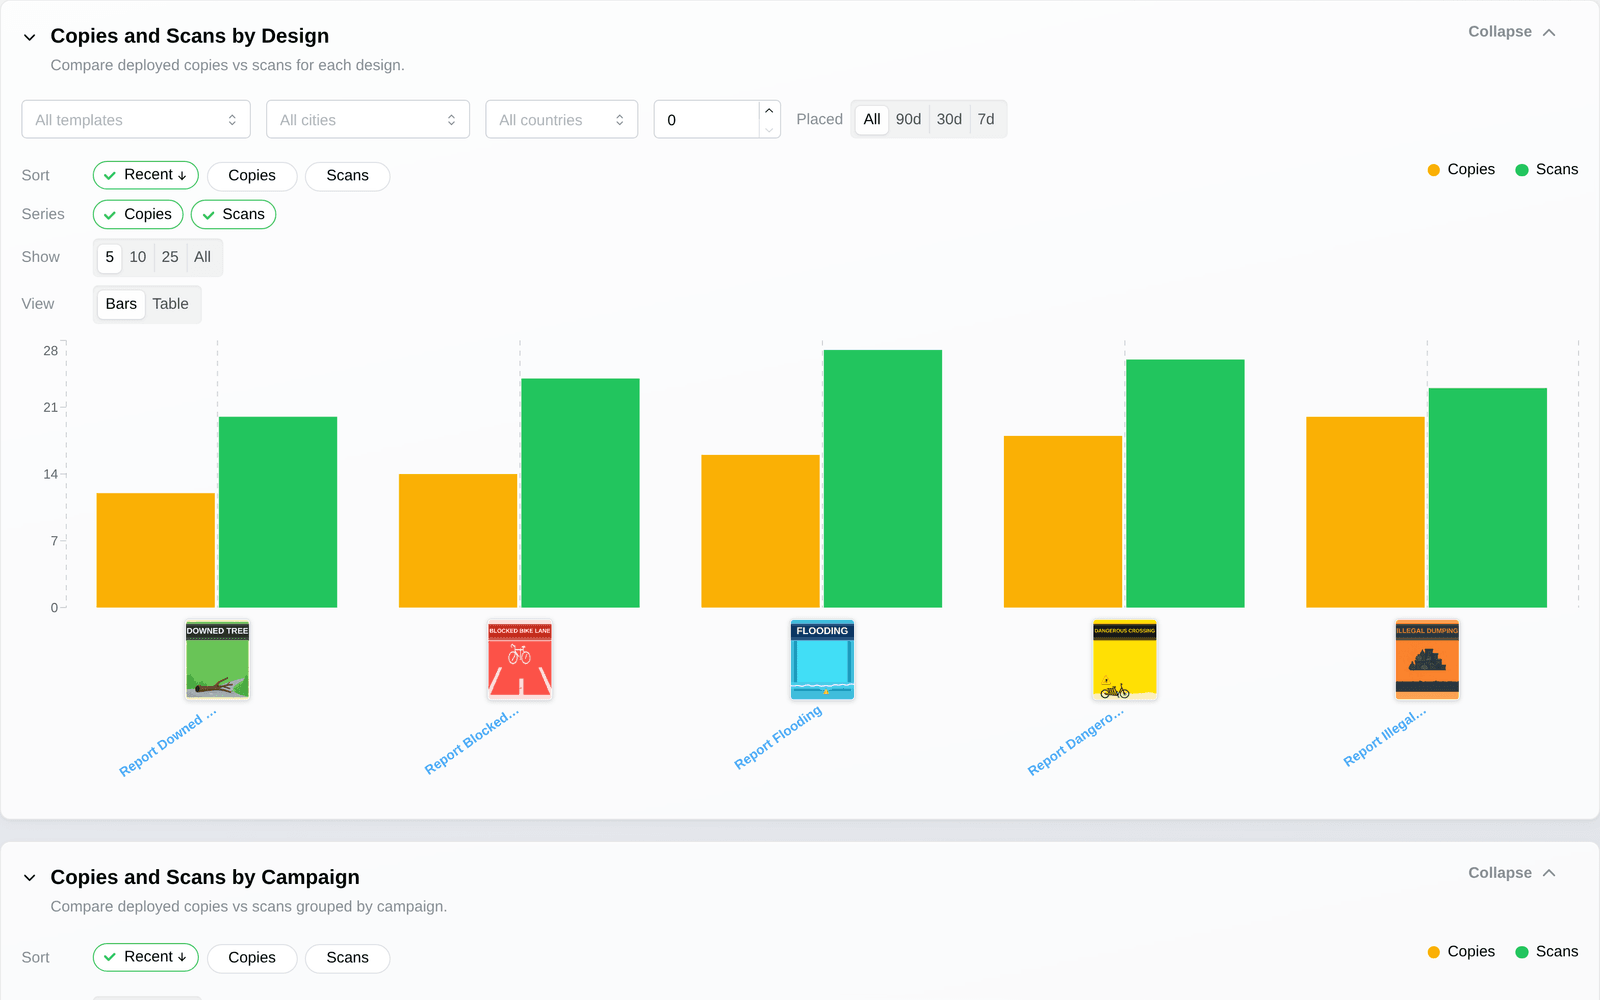
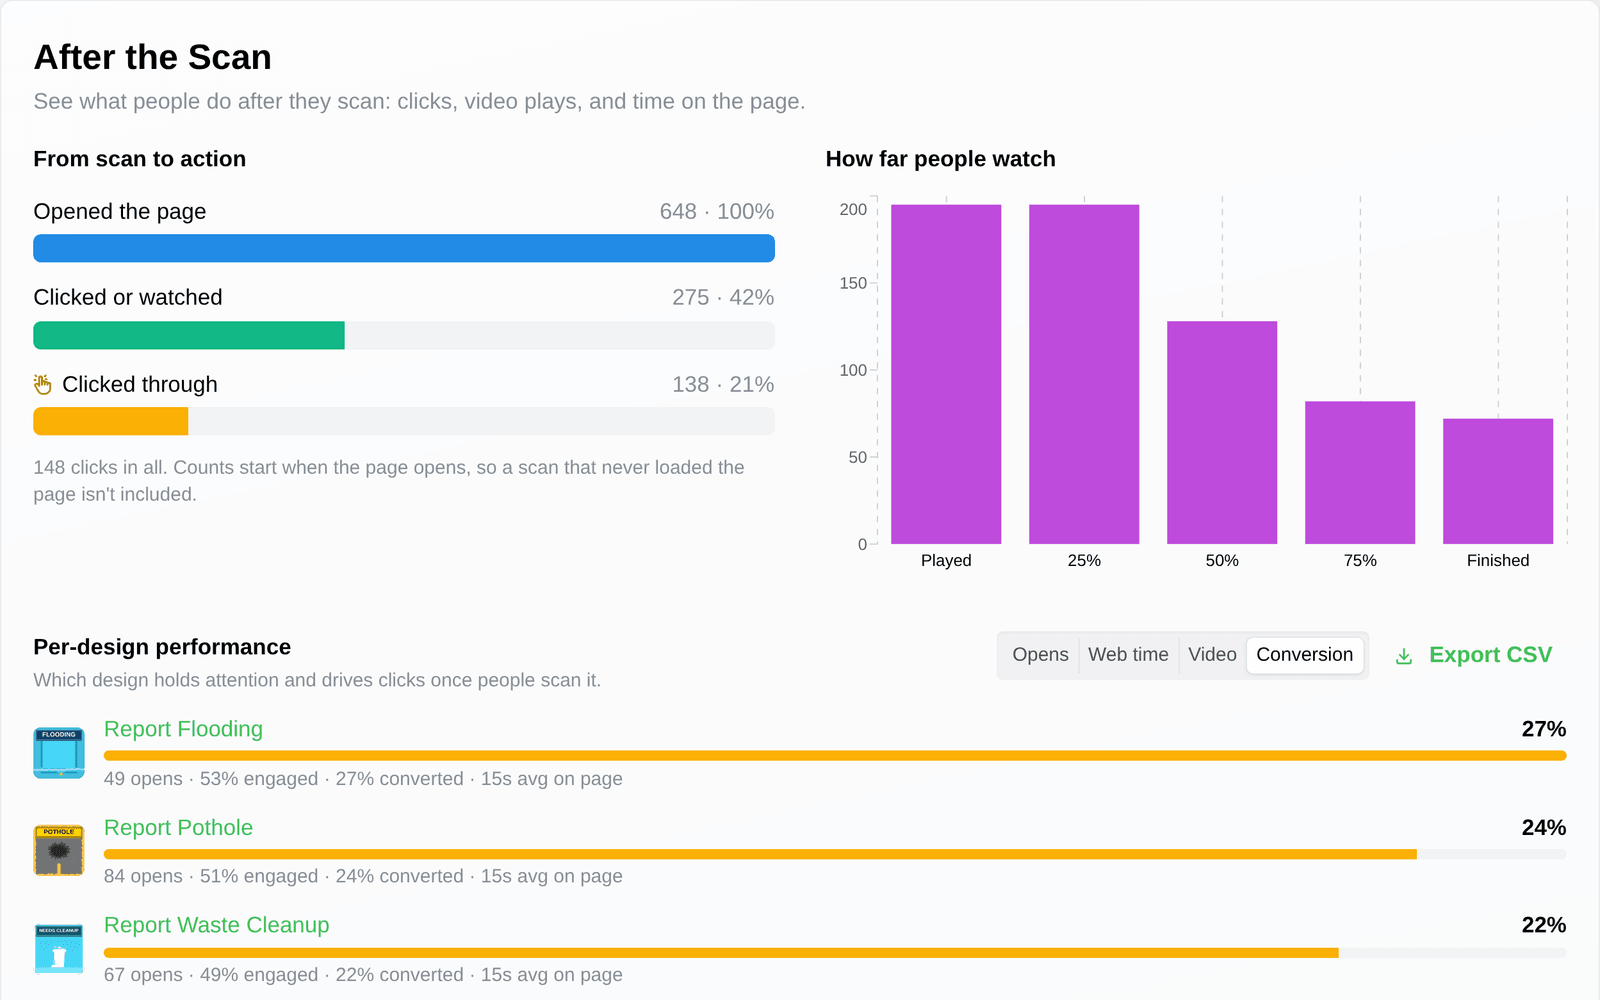
“Which design turned a scan into a click?”
Follow the action back to the source
Once someone reaches a campaign page, see what they did and trace it back to the asset, location, team, and partner behind it. Compare assets by the share who clicked through, and watch how far people get through the video before they drop off.
TraceReach is operated by TraceReach LLC.
See where engagement concentrates, and where it does not.
Compare locations, assets, teams, and partners with field proof and attribution behind the numbers.